State GDP Comparisons: Where Malaysia’s Wealth Concentrates
Breakdown of Peninsular Malaysia versus East Malaysia GDP figures, showing which sectors drive growth in different regions.
Read ArticleUnderstanding why East Malaysia lags behind Peninsular Malaysia in industrial development, infrastructure, and economic diversification efforts.

When you look at Malaysia’s economic map, a clear pattern emerges. Peninsular Malaysia dominates in nearly every metric — manufacturing output, technology hubs, financial services, urban development. But here’s the thing: Sabah and Sarawak, which together account for about 40% of Malaysia’s land area and 5.5 million people, contribute just over 6% of national GDP.
That’s not a small gap. It’s structural. And it didn’t happen by accident.
The disparity between East and Peninsular Malaysia reflects decades of infrastructure investment priorities, federal fiscal policies, and industrial development strategies. Understanding these gaps isn’t just academic — it’s crucial for anyone studying Malaysian economics, regional development, or Southeast Asian inequality patterns.

Let’s start with the baseline. Peninsular Malaysia’s per-capita GDP sits around RM45,000 annually. Sabah averages roughly RM32,000, while Sarawak performs slightly better at RM38,000. These aren’t trivial differences — they represent meaningful gaps in income, living standards, and economic opportunity.
But the gap isn’t just about current income. It’s about economic structure. Peninsular Malaysia’s economy is diversified across manufacturing (automotive, electronics, petrochemicals), services (finance, tourism, retail), and technology. Sabah and Sarawak remain heavily dependent on primary sectors — oil and gas, palm oil, logging, and agriculture account for over 50% of economic output in both states.
This dependency creates vulnerability. When global oil prices drop, Sabah’s government revenue contracts sharply. When palm prices fall, rural livelihoods suffer immediately. Peninsular Malaysia, by contrast, can absorb commodity price shocks across multiple economic sectors.
Key Metric: Manufacturing represents 23% of Peninsular Malaysia’s economy but only 8% of Sabah’s and 11% of Sarawak’s economies.


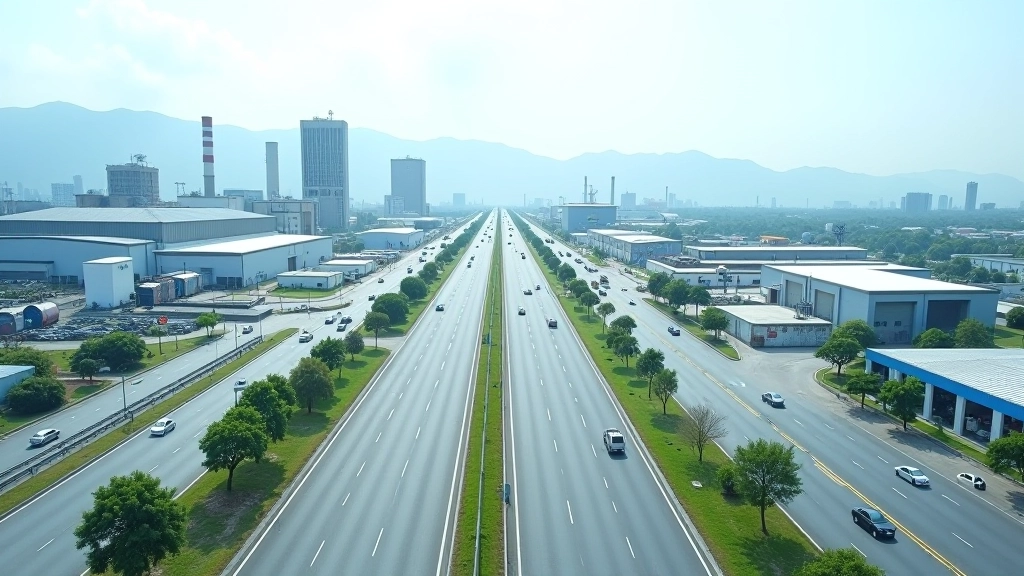
Infrastructure investment tells much of the story. Between 2010 and 2020, Peninsular Malaysia received approximately 72% of all federal infrastructure spending despite having 65% of the population. Roads, ports, airports, and telecommunications networks — the foundations of modern economies — were built disproportionately in the peninsula.
Sabah and Sarawak face particular challenges. Port capacity is limited. Highway networks are less integrated. Broadband penetration lags behind the peninsula by 15-20 percentage points. These aren’t cosmetic differences. They’re fundamental constraints on economic growth.
Consider logistics costs. A manufacturer in Selangor can ship products to Singapore in hours. A producer in Sarawak faces multi-day shipping times and higher transport costs, which directly reduces competitiveness for light manufacturing or export-oriented industries. This geography-driven disadvantage compounds over decades.
How does money actually flow from Kuala Lumpur to the states? It’s more complicated than most people realize. Federal transfers happen through several channels:
States receive a portion of federal tax revenue. However, this mechanism favors developed states — higher economic activity means higher tax collection, which benefits wealthier regions more.
Special allocations for infrastructure and development. These’re intended to reduce inequality, but allocation formulas often reflect political considerations alongside developmental need.
Theoretically designed to ensure all states can provide minimum services. In practice, these transfers haven’t been sufficient to close the gap or overcome structural disadvantages.
The real issue? These mechanisms don’t address why the gap exists in the first place. You can transfer money, but if underlying economic structures remain unbalanced, you’re treating symptoms rather than causes.
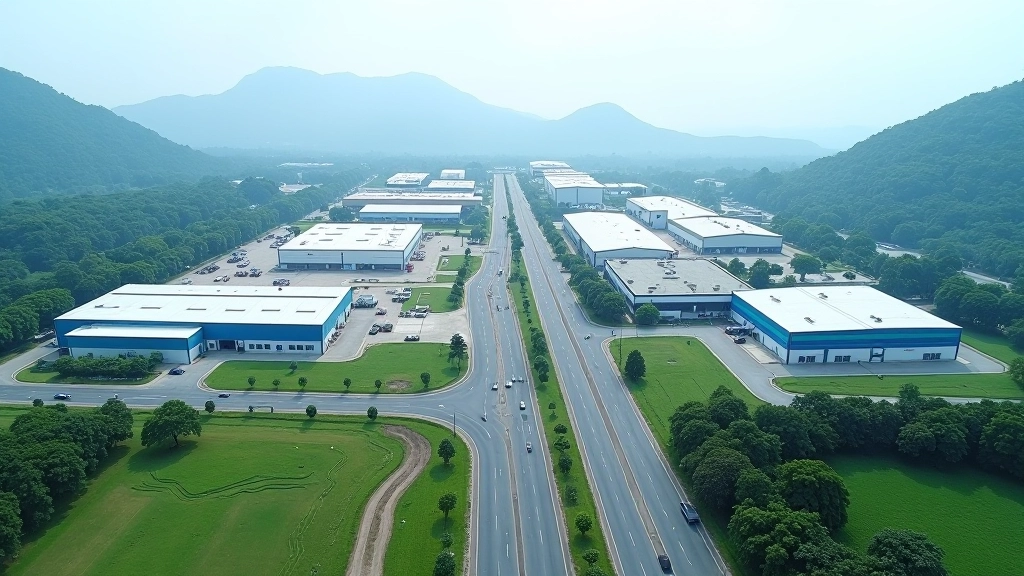
Malaysia’s government recognized these disparities and launched targeted corridor programs. The Iskandar Malaysia corridor (Johor), Northern Corridor Economic Region (Kedah, Perlis, Penang), and Sabah Development Corridor (SDC) were designed to create localized growth zones.
The results have been mixed. Iskandar Malaysia attracted significant investment and generated measurable economic growth. The Northern Corridor showed improvement in specific sectors. But Sabah Development Corridor and the equivalent programs in East Malaysia haven’t achieved comparable success.
Why? Partly because corridors work best when they connect existing economic strengths to new opportunities. Peninsular Malaysia’s corridors could leverage existing manufacturing bases, financial sectors, and technology ecosystems. East Malaysian corridors started from weaker economic foundations and faced geographic isolation. Distance from major markets, smaller domestic markets, and limited skilled labor pools all constrained their effectiveness.
“Economic corridors can accelerate growth, but they can’t overcome fundamental structural constraints without accompanying investments in human capital, connectivity, and diversification.”
The Sabah and Sarawak development gap isn’t a puzzle with a simple solution. It reflects interconnected factors: geographic distance from major markets, historical investment patterns, commodity dependence, infrastructure constraints, and limited industrial diversity. These don’t exist in isolation — they reinforce each other.
Closing the gap requires sustained, multifaceted effort. Better infrastructure connectivity. Investments in education and skills development. Diversification away from primary sectors. Attracting technology and knowledge-intensive industries. These changes take time — decades, not years.
Federal transfer mechanisms help, but they’re insufficient alone. Economic corridors create opportunities, but need supportive conditions to succeed. The real question isn’t whether the gap can narrow — it can — but whether there’s sufficient political will and fiscal commitment to make it happen consistently over the long term.
This article provides educational information about Malaysian regional economic disparities, state GDP comparisons, and development policies. The analysis is based on publicly available economic data and policy documents as of March 2026. Economic conditions, policies, and statistics evolve continuously. For current policy decisions, official investment considerations, or specific business applications, consult official sources including the Department of Statistics Malaysia, individual state economic development agencies, and the Ministry of Finance Malaysia. This content is informational and doesn’t constitute economic advice or policy recommendations.